Physical resources: Difference between revisions
mNo edit summary |
mNo edit summary |
||
| Line 2: | Line 2: | ||
==Wind== | ==Wind== | ||
Wind resource measurement for the area are provided by two different sources. The fist is one of fourteen meta-level wind resource assessments commissioned for the [http://www.nve.no/en/Energy/ Norwegian Water and Energy Directorate]for the Troms region in which Lyngen is situated. The maps | Wind resource measurement for the area are provided by two different sources. The fist is one of fourteen meta-level wind resource assessments commissioned for the [http://www.nve.no/en/Energy/ Norwegian Water and Energy Directorate]for the Troms region in which Lyngen is situated. The first two maps show the topography and expected wind speeds in meters / second for a height of 50 meters. Unfortunately the modeling is only done for the northern tip of the Lyngen peninsula. The final set of graphs is taken from the weather station data perched roughly 12m on top of the FabLab.'''Note''': The weather station is situated directly behind two wooden cross posts on its north side. This could affect the quality of the wind data. A second area of concern is the positioning of the lab directly to the north of a grove of trees (see [[FabLabtopo]] ) | ||
<gallery widths=350px heights=350px caption="Wind Resource"> | |||
Image:Troms | Image:Troms windmaptopo50.jpg|Topography map of Lyngen peninsula 50m wind mapping | ||
Image:Troms windmap50.jpg | Lyngen peninsula 50m wind mapping | |||
Image:FabLabWind data08-10.jpg | FabLab on-sitewind data graphs | |||
</gallery> | </gallery> | ||
Revision as of 15:35, 18 August 2010
Physical resources for the MIT-FabLab in Lyngen can be defined as everything that can be a possibly used as source of energy to support the lab. Most commonly this energy is either used as a form of heat or is converted into electricity.
Wind
Wind resource measurement for the area are provided by two different sources. The fist is one of fourteen meta-level wind resource assessments commissioned for the Norwegian Water and Energy Directoratefor the Troms region in which Lyngen is situated. The first two maps show the topography and expected wind speeds in meters / second for a height of 50 meters. Unfortunately the modeling is only done for the northern tip of the Lyngen peninsula. The final set of graphs is taken from the weather station data perched roughly 12m on top of the FabLab.Note: The weather station is situated directly behind two wooden cross posts on its north side. This could affect the quality of the wind data. A second area of concern is the positioning of the lab directly to the north of a grove of trees (see FabLabtopo )
- Wind Resource
-
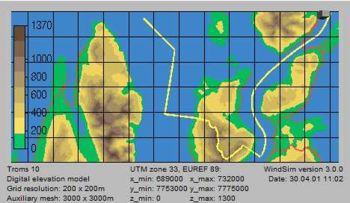 Topography map of Lyngen peninsula 50m wind mapping
 -
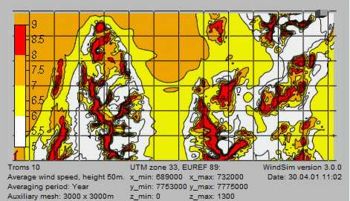 Lyngen peninsula 50m wind mapping
 -
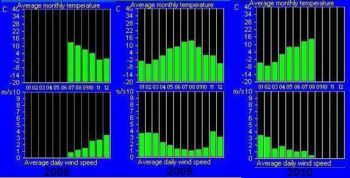 FabLab on-sitewind data graphs


