Difference between revisions of "Physical resources"
m |
|||
| (12 intermediate revisions by the same user not shown) | |||
| Line 2: | Line 2: | ||
==Wind== | ==Wind== | ||
| − | Wind resource measurement for the area are provided by two different sources. The fist is one of fourteen meta-level wind resource assessments commissioned for the [http://www.nve.no/en/Energy/ Norwegian Water and Energy Directorate]for the Troms region in which Lyngen is situated. The maps | + | Wind resource measurement for the area are provided by two different sources. The fist is one of fourteen meta-level wind resource assessments commissioned for the [http://www.nve.no/en/Energy/ Norwegian Water and Energy Directorate]for the Troms region in which Lyngen is situated. The first two maps show the topography and expected wind speeds in meters / second for a height of 50 meters. Unfortunately the modeling is only done for the northern tip of the Lyngen peninsula. The final set of graphs is taken from the weather station data perched roughly 12m on top of the FabLab.'''Note''': The weather station is situated directly behind two wooden cross posts on its north side. This could affect the quality of the wind data. A second area of concern is the positioning of the lab directly to the north of a grove of trees (see [[:Image:FabLabtopo,39k.jpg]] ) |
| − | + | ||
| − | + | ||
| − | + | <gallery widths=200px heights=200px caption="Wind Resource"> | |
| − | Image:Troms | + | Image:Troms windmaptopo50.jpg|Topography map of Lyngen peninsula 50m wind mapping |
| − | + | Image:Troms windmap50.jpg | Lyngen peninsula 50m wind mapping | |
| + | |||
| + | Image:FabLabWind data08-10.jpg | FabLab on-sitewind data graphs | ||
| − | |||
</gallery> | </gallery> | ||
| + | ==Geological== | ||
| + | [[Image:Bedrock lyngenmap.jpg|thumb|400px|The prominent geology for the area surrounding the FabLab]] | ||
| + | The prominent bedrock for the Lyngen area and around the FabLab according to [http://www.ngu.no/no/ NGU] (the Norwegian national Institution for knowledge on bedrock, mineral resources, surficial deposits and groundwater) [http://tin.er.usgs.gov/geology/state/sgmc-unit.php?unit=NCCAZfg;6] Mica Gneiss, [http://en.wikipedia.org/wiki/Schist Schist], [http://tin.er.usgs.gov/geology/state/sgmc-unit.php?unit=VAmss;0 Metasandstone], and [http://en.wikipedia.org/wiki/Amphibolite Amphibolite]are the suggested bedrock present if geothermal energy is to be considered. | ||
| + | |||
| + | ==Hydrologic== | ||
| + | [[Image:HyrdoFabLab1.jpg|thumb|left|400px|The available hydrologic resources surrounding the MIT-FabLab]] | ||
| + | According to the mapping provided by [http://www.ngu.no/no/ NGU] the largest source of potential hydro energy would be the area of the river to the right of the nature reserve boundary which is set by the vertical green line that goes along the cliffs of the FabLab area topomap. | ||
| + | |||
| + | ==Solar== | ||
| + | ==Biomass== | ||
Latest revision as of 21:58, 7 September 2010
Physical resources for the MIT-FabLab in Lyngen can be defined as everything that can be a possibly used as source of energy to support the lab. Most commonly this energy is either used as a form of heat or is converted into electricity.
Contents
Wind
Wind resource measurement for the area are provided by two different sources. The fist is one of fourteen meta-level wind resource assessments commissioned for the Norwegian Water and Energy Directoratefor the Troms region in which Lyngen is situated. The first two maps show the topography and expected wind speeds in meters / second for a height of 50 meters. Unfortunately the modeling is only done for the northern tip of the Lyngen peninsula. The final set of graphs is taken from the weather station data perched roughly 12m on top of the FabLab.Note: The weather station is situated directly behind two wooden cross posts on its north side. This could affect the quality of the wind data. A second area of concern is the positioning of the lab directly to the north of a grove of trees (see Image:FabLabtopo,39k.jpg )
- Wind Resource
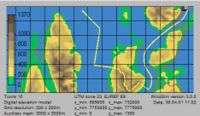
Topography map of Lyngen peninsula 50m wind mapping
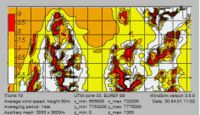
Lyngen peninsula 50m wind mapping
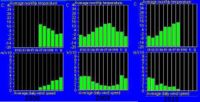
FabLab on-sitewind data graphs


Geological

The prominent bedrock for the Lyngen area and around the FabLab according to NGU (the Norwegian national Institution for knowledge on bedrock, mineral resources, surficial deposits and groundwater) [1] Mica Gneiss, Schist, Metasandstone, and Amphiboliteare the suggested bedrock present if geothermal energy is to be considered.
Hydrologic

According to the mapping provided by NGU the largest source of potential hydro energy would be the area of the river to the right of the nature reserve boundary which is set by the vertical green line that goes along the cliffs of the FabLab area topomap.